
|
Brussels, |
|
State of Energy Union in 2021
 Click to read
On 24 October 2023, the EU Commission published the Eighth Report on the State of the Energy Union 2021, that it takes stock of changes and progress in the implementation of EU energy and climate policies, including energy union through its 5 pillars, on the road to climate neutrality by 2050.
Some of the most relevant findings include:
Some of the most relevant findings include:
- Greenhouse Gas Emissions: In 2020, EU greenhouse gas emissions, including international aviation, were down by 31% compared to 1990 levels. This decrease was partly due to the pandemic's impact on energy consumption, as well as ongoing decarbonization efforts.
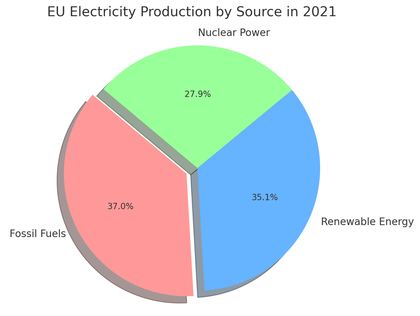
- Renewables vs. Fossil Fuels: For the first time in 2020, renewable energy sources overtook fossil fuels as the EU’s main power source, contributing 38% of EU electricity, compared to 37% from fossil fuels and 25% from nuclear power. The share of renewable energy in the overall EU energy mix was expected to have reached at least 22%.
- Energy Consumption: EU primary energy consumption declined by 1.9%, and final energy consumption by 0.6% in 2019 compared to 2018.
- Energy Import Dependency: The EU's net energy import dependency reached 60.6% in 2019, the highest level in the past 30 years.
- Fossil Fuel Subsidies: These subsidies decreased slightly in 2020 to EUR 52 billion, down from EUR 56 billion in 2019, mainly due to reduced consumption during COVID-19-related restrictions.
- Coal Phase-Out: Nine EU Member States have phased out coal, 13 have committed to do so by a certain date, four are considering possible dates, and only one has not started discussions on a phase-out.
- Energy Prices and Consumption Trends: Energy prices fluctuated significantly, with wholesale energy prices falling sharply in 2019 due to cheaper fuels, subdued demand, and expanding renewable generation. However, wholesale electricity prices increased by 230% on a yearly basis by September 2021, largely driven by rising gas prices.
- Electricity Consumption: More than 98.6% of EU electricity consumption is coupled, and traded volumes on natural gas hubs reached an all-time high in 2019, continuing the trend into 2020.
- Research & Innovation Spending: Public clean energy R&I spending in Member States remains lower than in 2010, but national and EU recovery funding targeting clean energy R&I can partially compensate for this reduction.
- Energy Poverty: Up to 31 million people in the EU were affected by energy poverty as of 2019, highlighting the need for a just transition towards climate neutrality and protecting vulnerable populations from price spikes
EU Energy in Figures
 Click to read
Energy is a cornerstone of modern economies, driving growth, competitiveness, and development. As Europe undergoes a dynamic transformation in its energy landscape, access to precise and current data becomes crucial. This publication presents a comprehensive summary of the most pertinent annual energy statistics relevant to the European Union and its Member States.
The data in this pocketbook originates from various authoritative sources, including Eurostat, other services of the European Commission, the European Environment Agency, and the International Energy Agency.
Structured into five distinct sections, the publication covers a broad spectrum of energy-related topics:
The indicators in this publication are derived using methodologies established by the European Commission’s Directorate-General for Energy, in alignment with Eurostat and other international statistical standards.
Additionally, this publication includes appendices with a glossary and methodological notes, offering further clarity and context. The data presented herein represents the most recent available at the time of this publication's release, ensuring readers have access to the latest insights and trends in the EU energy sector.
The data in this pocketbook originates from various authoritative sources, including Eurostat, other services of the European Commission, the European Environment Agency, and the International Energy Agency.
Structured into five distinct sections, the publication covers a broad spectrum of energy-related topics:
- Global and EU Energy Overview: An encapsulation of key energy data at the world and EU levels.
- Main Energy Statistics and Indicators: Focused on the EU and its Member States, this part delves into core energy statistics and benchmarks.
- Socio-Economic Indicators in the EU: Examining the intersection of energy with social and economic parameters within the Union.
- Greenhouse Gas Emissions in the EU: An analysis of the EU's greenhouse gas emissions, highlighting environmental impacts.
- Country Profiles: Detailed statistics and indicators for each EU Member State, providing a country-specific perspective.
The indicators in this publication are derived using methodologies established by the European Commission’s Directorate-General for Energy, in alignment with Eurostat and other international statistical standards.
Additionally, this publication includes appendices with a glossary and methodological notes, offering further clarity and context. The data presented herein represents the most recent available at the time of this publication's release, ensuring readers have access to the latest insights and trends in the EU energy sector.
Energy Consumption and Energy Produced in 2021

The updated histogram chart displays the EU's energy consumption by source in 2021, sorted by the percentage share of each energy source. This visualization provides a clearer comparison of the relative significance of each energy source in the EU's energy mix for that year. Data provided by EUROSTAT
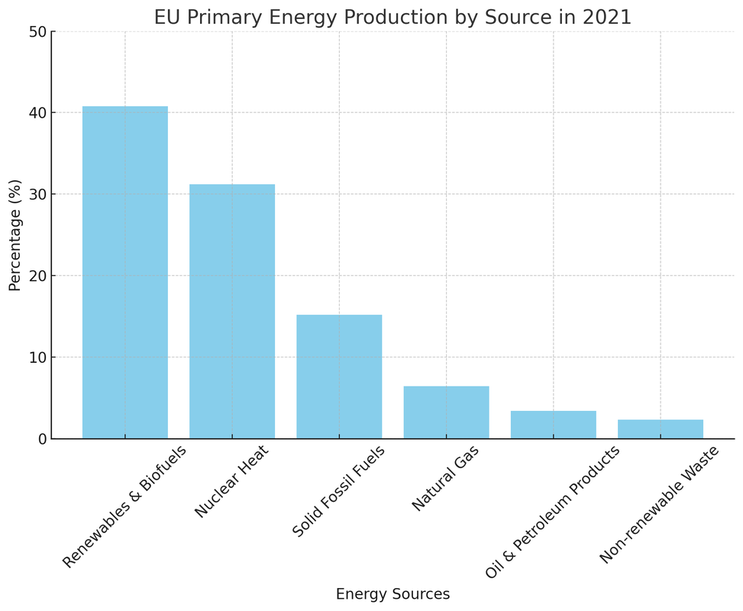
Here is a histogram chart illustrating the EU's primary energy production by source in 2021. The chart shows the percentage share of each energy source, highlighting the dominance of renewables and biofuels in the EU's energy mix for that year. Data provided by EUROSTAT
The European Union's primary energy production includes energy generated from various sources within its borders. Inland sources of primary energy production in the EU typically refer to energy sources that originate within the EU's territory and are not imported. These sources can vary from country to country within the EU and may include:
It's important to note that the availability of these energy sources varies from one EU member state to another, depending on their geographical location and natural resources. The EU as a whole promotes the transition to cleaner and more sustainable energy sources to reduce its dependence on fossil fuels and combat climate change. That the reason why the 75
The European Union's primary energy production includes energy generated from various sources within its borders. Inland sources of primary energy production in the EU typically refer to energy sources that originate within the EU's territory and are not imported. These sources can vary from country to country within the EU and may include:
- Fossil Fuels: This category includes coal, natural gas, and oil extracted from domestic sources. Some EU countries have significant coal and natural gas reserves, which contribute to their primary energy production.
- Renewables: Renewable energy sources like wind, solar, hydroelectric, and biomass play a growing role in the EU's primary energy production. These sources harness energy from within the EU, such as wind turbines generating electricity from the wind or solar panels capturing energy from sunlight.
- Nuclear Power: Some EU member states rely on nuclear power plants for a significant portion of their electricity generation. Nuclear energy is considered an inland source as long as the fuel used in the reactors is domestically produced or imported.
- Biomass and Biofuels: Biomass energy, derived from organic materials like wood, crop residues, and waste, is often produced within the EU. Biofuels, such as biodiesel and bioethanol, can be made from domestically grown crops.
- Geothermal Energy: Geothermal power plants utilize heat from the Earth's interior, and these resources can be found in various regions of the EU.
- Hydroelectric Power: Some EU countries have substantial hydroelectric power capacity, utilizing rivers and water resources within their borders.
It's important to note that the availability of these energy sources varies from one EU member state to another, depending on their geographical location and natural resources. The EU as a whole promotes the transition to cleaner and more sustainable energy sources to reduce its dependence on fossil fuels and combat climate change. That the reason why the 75
Electricity Production in EU
Click to enlarge
|
Click to enlarge
|
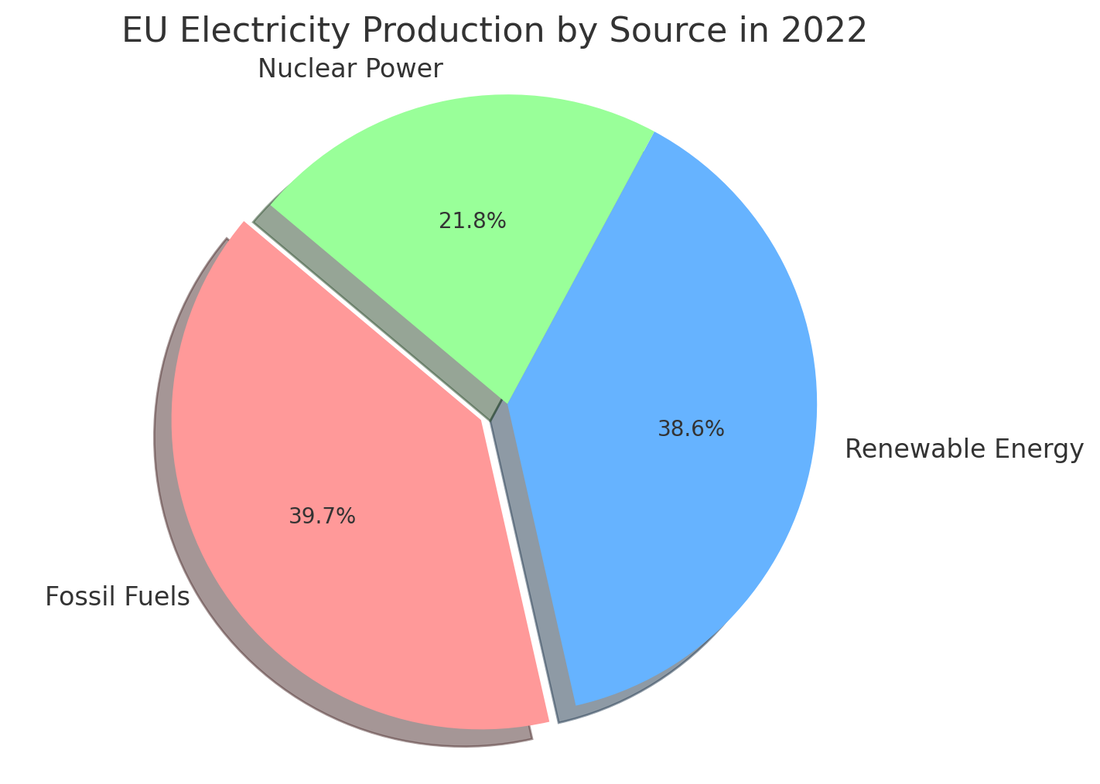
Here pie charts depicting the distribution of various energy sources used for electricity production in the European Union in 2021 and provisional data for 2022. This visualization provides a clear overview of the proportionate contribution of each energy source, such as nuclear power, wind turbines, hydropower plants, solar power, and combustible fuels, to the EU's electricity generation in these years.
Note
In 2022, Europe experienced a significant decrease in nuclear energy production, partially offset by an increase in the use of fossil fuels. This situation was influenced by several factors:
In 2022, Europe experienced a significant decrease in nuclear energy production, partially offset by an increase in the use of fossil fuels. This situation was influenced by several factors:
- Maintenance and Extended Shutdowns: The decrease in nuclear energy production was due to maintenance and extended shutdowns of nuclear power plants
- Extreme Weather Conditions: The exceptionally hot and dry summer of 2022 in many EU countries also impacted hydroelectric production, another important source of clean energy
- Impact of the Energy Crisis: Recent years have been marked by uncertainties and fluctuations in the energy sector. Natural gas prices soared in the latter half of 2021 and into 2022, exacerbated by sanctions on imports from Russia and disruptions in natural gas supply. These conditions led to a spike in natural gas prices, thus pushing Europe to rely more on fossil fuels
- EU Policy Response: The European Union adopted measures to reduce electricity demand and use energy surpluses more efficiently. Additionally, it proposed measures for joint gas purchasing and mechanisms to limit prices, as well as encouraging solidarity among member states in energy demand management
. - Demand Reduction and High Prices: EU member states agreed to reduce overall electricity demand by 10% and peak-hour demand by 5%. This impacted the reduction in the use of gas for electricity production, influencing prices and market pressure
Data provided by EUROSTAT
Source: European Union, http://www.europa.eu/, 1998-2024
|
Brussels - Milano - Nice - Tokyo
|
eEuropa Belgium
Avenue Louise, 367 1050 Brussels BELGIUM Bld. Franck Pilatte, 19 bis
06300 Nice FRANCE YONO HOUSE 9-1 KAMIOCHIAI, SAITAMA-SHI, SAITAMA-KEN 〒 338-0001 JAPAN Via S. Veniero 6 20148 Milano ITALY |
All rights reserved - © Copyright eEuropa Belgium 2020-2024